Stall · Double Stall · Causes · Flying insects · Economic implications
Stall is referred to as the loss of lift force of a blade due to changes in its aerodynamic behavior. This is the same effect that suffers an aircraft when airspeed is too low, the wing lift force decreases and the aircraft stalls.
In the case of Pitch controlled wind turbines, stall is induced by the rotation of the blade over its axis. In Stall controlled turbines, the design of the blade produces a progressive stall effect over a certain wind speed maintaining the torque on the rotor as the airspeed increases. In this scenario, the design of the blade plays a critical role on the power output and stability of the turbine.
The power curve is the representation of the power output of a given turbine at any wind speed and it is unique to that turbine.
 |
If no aerodynamic loss (stall) were present, the power output (rotor speed) would increase with no limit, causing mechanical and structural failure on the turbine.
The key to maximize performance is to design a turbine with a power curve as steepest as possible on the ascending part of the plot (more power output at low wind speeds) and as flat as possible past the maximum power output.
This is a typical phenomenon of stall controlled turbines although it also occurs on pitch controlled turbines. Double stall is referred to as a second and unpredicted aerodynamic loss in the blade, not related to the blade design and that produces a decrease in the energy that is extracted from the wind by the rotor.
The following power curve shows a typical 1 MW turbine affected by double stall (blue) in relation with the manufacturer's power curve (red):
 |
The shaded area shows the power loss as the consequence of this phenomenon that, depending on the wind speed, it can add up to 50% of the production. This effect is quite obvious at high wind speeds (large mismatch between theoretical and real power curves), however, at low wind speeds the plot is displaced to the right causing a production loss on the most frequent range of wind speeds. [Top]
There are several factors that may cause double stall. These can be a malfunction in the yaw system, a faulty blade design or the accumulation of insects, ice, oil, dust or salt on the leading edge of the blade. In any case, the result is the modification of the aerodynamic profile of the blade producing a poorer transformation of the energy of the wind into torque.
Since the publication of Corten's PhD thesis (2001) about the implications of the accumulation of insects in the leading edge of the blades, this hypothesis has gained strength and other prestigious journals like Science and Nature have published articles on the matter. [Top]
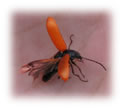
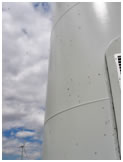
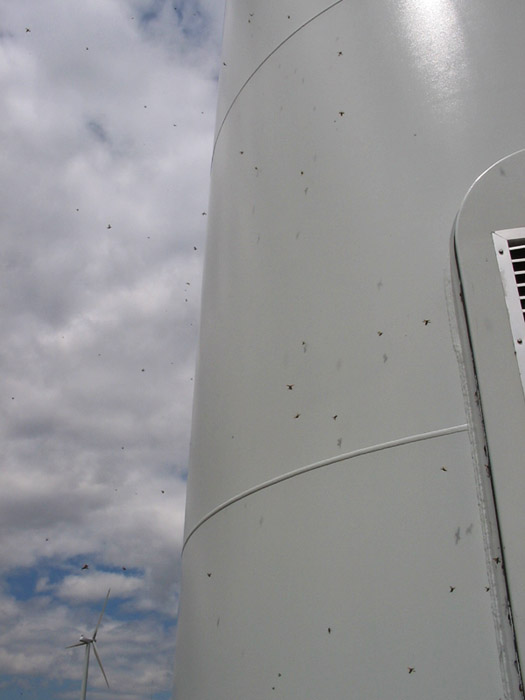
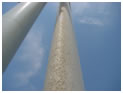
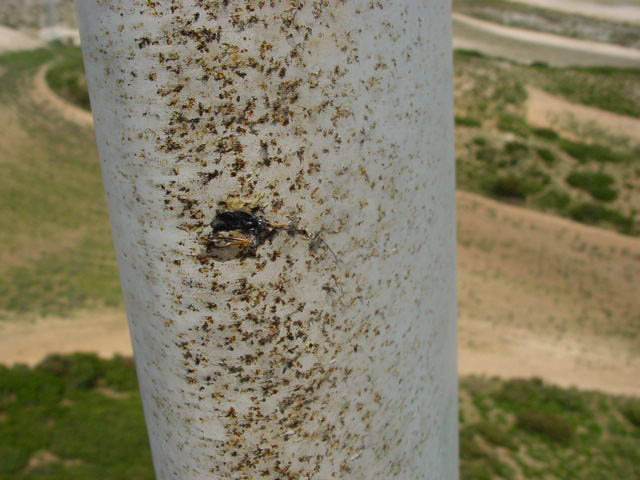
The following image shows flying beetles in the surroundings of a tower of Magallon 26 wind farm in May 2005:
 |
When these 'clouds' of beetles reach the rotor swept area the blades impact on them causing the blades look like the pictures below:

|
 |
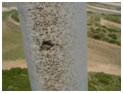 |
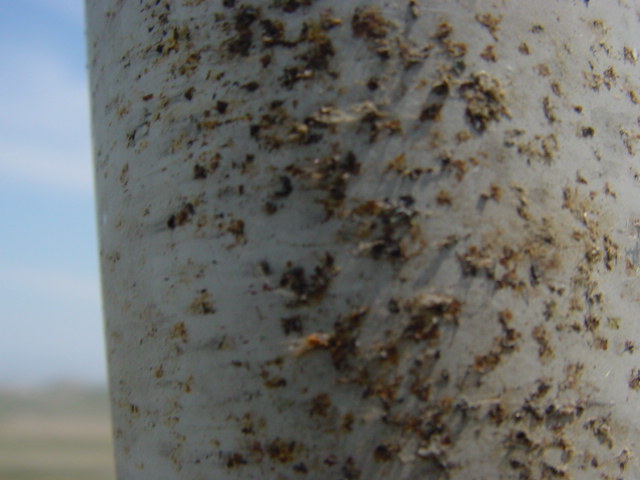
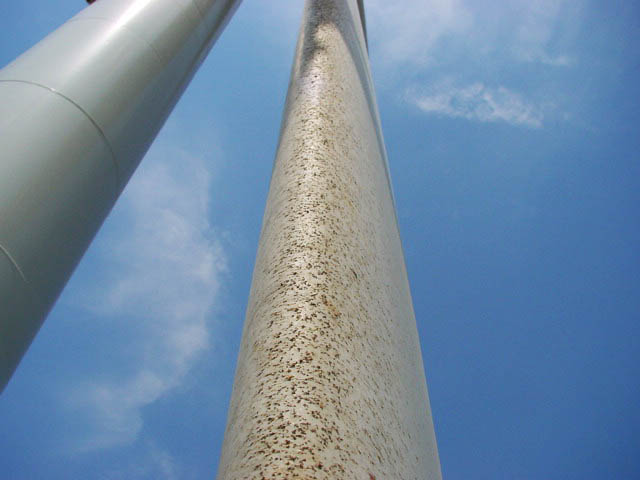
The increase in rugosity penalize severely the aerodynamic efficiency of the blade. [Top]
The effect of insect debris accumulation in the blades has been under study since 2004 in Magallon 26 wind farm (10.8 MW) in Zaragoza, Spain. The owner of the wind farm developed in 2005 the Blade Cleaning system and was installed in every turbine.
It has been proved that the implications of insect caused double stall are substantial. Taking the data from this real case, the calculations for a typical 1 MW wind farm result as follows:
| Nominal power: | 1,000 kW |
| Annual equivalent hours: | 2,500 h |
| Theoretical production: | 2,500,000 kWh |
| Price: | 0.08 €/kWh |
| Predicted income: | 200,000 €/year |
| Double Stall | |
| Average loss on power curve: | 10 % |
| Production loss: | 250,000 kWh |
| Income loss: | 20,000 €/year per installed MW |
Therefore, assuming a 10% annual average power loss on the power curve, production can fall up to a quarter of a GWh per year (equivalent to the annual consumption of 71 households) and a revenue loss of 20,000 € per year.
The implications of the double stall phenomenon not only affect the expected revenue of the wind farm but also the National Grid system as the predictions of power output are less accurate. Besides, the increasing mismatch between expected and actual production may convey sanctions from the grid operator.
Facts and comparisons
There are a few considerations to be made:
- Blade cleaning:
- Turbine power output reach the optimum value just after a cleaning operation
- As soon as dirt accumulates again, the power curve drops
- Manual cleaning:
- A minimum time of 4 hours is required to perform a clean of the blades (turbine stopped, not producing)
- 2-3 qualified operators are needed as well as specialized equipment
- There is physical contact with the moving parts of the turbine if a lifting device needs to be installed. Otherwise a crane is needed
- Wind speed of less than 3 m/s is required to operate on the turbine
- Expensive
- High risk operation